When a motion sensor triggers in the hallway, the lighting should respond before conscious thought—before the mind even registers the shift from darkness to illumination. That seamless transition, that invisible orchestration, lives or dies in the milliseconds between signal and execution. Understanding how to test smart device latency transforms guesswork into precision, ensuring automations feel like natural extensions of the space rather than clunky afterthoughts that trail behind movement.
This guide walks through practical latency testing across Zigbee, Z-Wave, Thread, Matter, and Wi-Fi protocols, revealing which devices respond fast enough to disappear into the rhythm of daily life and which introduce perceptible lag. The process requires no specialized equipment beyond what most integrated homes already possess, though a smartphone stopwatch and methodical note-taking prove essential. Plan approximately 90 minutes for comprehensive testing across multiple devices and protocols—less if focusing on a single ecosystem.
The measurements matter because latency compounds. A sensor that takes 200ms to wake, feeding a hub that processes in 150ms, controlling a switch that executes in 100ms—suddenly that "instant" automation stretches past half a second, long enough to feel mechanical rather than magical.
What You'll Need
- Smartphone with stopwatch or video recording capability (frame-by-frame playback reveals sub-second delays)
- Network analysis tool: Fing app or router admin panel for tracking device communication paths
- Test devices across protocols: At least one motion sensor and one actuator (light, plug, lock) per protocol you're evaluating
- Active hub or controller: For Zigbee, Z-Wave, or Thread networks—Understanding Concealed Smart Home Hubs: Z-Wave, Zigbee & Matter Compatibility clarifies requirements
- Notebook or spreadsheet: Record timestamps, protocol types, hub locations, and network conditions
- Optional: Secondary timer device: Physical stopwatch provides redundancy when testing smartphone-controlled automations
- Baseline automation rules: Simple if/then logic already configured (IF motion detected, THEN turn on light)
Wi-Fi devices bypass mesh networks but depend on router proximity and bandwidth availability. Zigbee and Thread devices benefit from mesh topology—more nodes can actually reduce latency by providing shorter communication hops.
Step 1: Establish Baseline Network Conditions
Before testing how to test smart device latency meaningfully, document the environment in which devices operate. Network congestion, hub CPU load, and physical distance between nodes all influence response times, yet most testing overlooks these foundational variables.
Open your router's admin interface and note the current device count on both 2.4GHz and 5GHz bands. Wi-Fi protocols suffer disproportionately when 20+ devices share bandwidth—expect 300-500ms additional latency during peak usage compared to off-hours. Zigbee operates on the same 2.4GHz spectrum but uses different channels; verify your Zigbee hub isn't set to channel 20 if your Wi-Fi broadcasts on channel 11, as overlap degrades both networks.
Check your hub's current CPU and memory usage if accessible through the interface. Home Assistant and Hubitat both expose these metrics—anything above 70% sustained load introduces unpredictable delays. A hub processing energy monitoring data from ten smart plugs while simultaneously running presence detection routines may queue motion sensor signals behind lower-priority tasks.
Map the physical mesh topology for Zigbee, Z-Wave, and Thread networks. Most hub software includes a topology viewer showing which devices route through which repeaters. A motion sensor connecting through three hops to reach the hub naturally introduces more latency than one with direct line-of-sight communication. Document these paths—they become critical when interpreting results.
Test during a controlled time window: late evening when network traffic diminishes but before devices enter sleep modes. This creates reproducible conditions for subsequent testing sessions.
Step 2: Isolate Single-Device Response Time
Strip the automation to its simplest form: one sensor, one actuator, one hub. This baseline reveals inherent protocol latency before conditional logic or secondary device coordination muddy the data.
Create a test automation with minimal logic:
IF motion sensor detects movement
THEN turn on test light
DELAY: 0ms (no artificial delay)
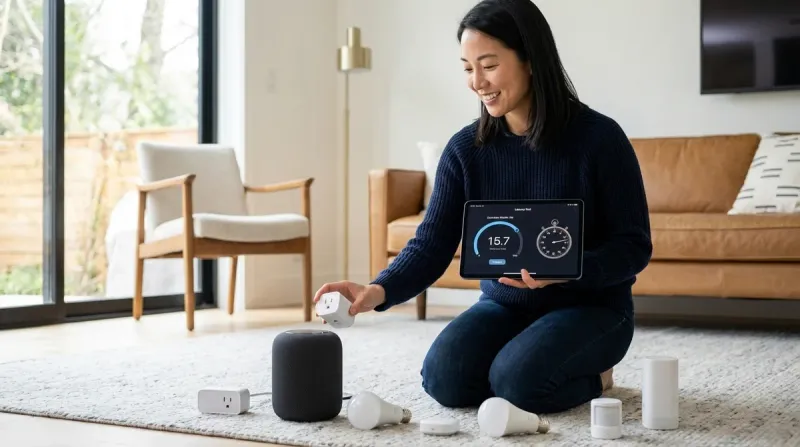
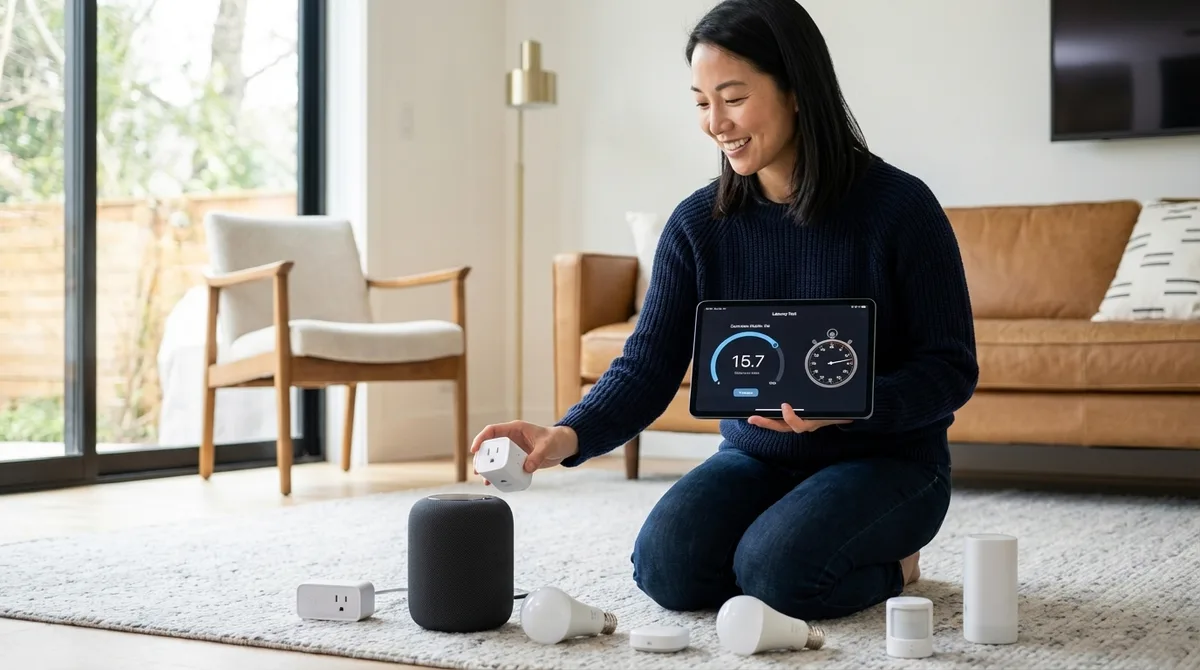
Position yourself equidistant from sensor and light with clear visibility of both. Start your smartphone's stopwatch, trigger the motion sensor deliberately—a single clean wave across its detection field—and stop the timer the instant the light energizes. The human reaction time introduces roughly 200ms variability, so repeat this measurement ten times and calculate the average. Outliers (measurements 200ms+ above average) suggest packet loss or retry events; note them separately.
For video-based measurement, record at 60fps and count frames between sensor trigger (visible movement entering detection zone) and light response (first visible brightening). Each frame represents 16.7ms—this precision matters when differentiating between protocols claiming <100ms response times.
Document whether the sensor was already "awake" from recent activity or triggered from sleep state. Battery-powered Zigbee motion sensors often sleep between events to conserve power, adding 50-150ms wake latency to the first trigger after idle periods. Z-Wave Plus devices typically wake faster at 30-80ms, while Thread sensors leverage low-power listening modes that maintain near-instant responsiveness.
The Philips Hue Motion Sensor (Zigbee) consistently tests between 80-120ms in optimal conditions, but jumps to 180-250ms on first trigger after 5+ minutes idle—a frustration in infrequently used hallways where that quarter-second lag becomes perceptible.
Step 3: Measure Multi-Device Coordination Latency
Real automations rarely involve single devices. Testing how to test smart device latency across coordinated actions reveals where response time degrades under practical conditions.
Build a three-device automation representing typical use:
IF motion detected in kitchen
THEN dim living room lights to 30%
AND turn on under-cabinet lights to 100%
DELAY: 0ms
This tests whether the hub executes commands serially (one device, wait for confirmation, next device) or broadcasts simultaneously. Measure from motion trigger to the last device completing its action—often the dimming light, as dimming requires more processing than simple on/off switching.
Zigbee hubs typically broadcast simultaneous commands to multiple devices, with total coordination latency around 100-200ms beyond single-device baseline. Z-Wave's beaming protocol introduces sequential overhead—expect 50-80ms additional latency per device in the chain. Matter promises simultaneous multi-device control through its unified fabric, though real-world implementation varies by controller.
Test the same automation ten times, noting whether both lights respond simultaneously or if one consistently lags. Staggered responses suggest the hub is processing sequentially rather than broadcasting. If latency exceeds 500ms total, investigate hub load, mesh path quality, or protocol-specific retry behavior.
Introduce a conditional modifier to test logic processing overhead:
IF motion detected in kitchen
AND time is after sunset
THEN dim living room lights to 30%
ELSE turn on living room lights to 100%
This conditional adds 10-30ms processing time on most hubs—negligible when the total response remains sub-200ms, but compounding when already dealing with higher baseline latency. Home Assistant's automation engine processes conditionals nearly instantaneously; proprietary hubs like SmartThings introduce slightly more overhead.
Step 4: Test Cross-Protocol Latency

Few homes commit entirely to one protocol. Testing how to test smart device latency across protocol boundaries exposes the friction points where seamless automation stumbles.
Create an automation spanning two protocols:
IF Zigbee motion sensor detects movement
THEN activate Z-Wave smart plug
The hub acts as translator, receiving the Zigbee message, processing it, then transmitting a Z-Wave command—a two-radio operation introducing 30-100ms additional latency compared to single-protocol automations. Matter 1.4 aims to eliminate this through native cross-protocol communication, though devices must support Matter natively rather than through hub-based translation.
Test variations:
- Zigbee sensor → Wi-Fi light: ~150-300ms total
- Thread sensor → Zigbee switch: ~100-180ms total
- Wi-Fi sensor → Z-Wave lock: ~250-500ms total
Wi-Fi consistently introduces the highest variability due to network congestion and cloud dependencies. Local-only Wi-Fi devices (like many Shelly switches configured without cloud) perform comparably to Zigbee at 100-150ms, while cloud-dependent devices (standard TP-Link Kasa without local API) can spike to 800ms+ during peak internet traffic.
Document whether fallback behavior exists when cross-protocol communication fails. Does the automation retry? Timeout and fail silently? Trigger an error notification? These characteristics matter more than raw speed when designing resilient systems—Smart Home Protocol Compatibility Explained: Zigbee, Z-Wave, Thread, Matter, and Wi-Fi explores these interoperability nuances deeply.
Step 5: Evaluate Latency Under Network Load
Morning routines compound demands: motion sensors firing simultaneously, thermostats adjusting setpoints, coffee makers powering on, smart speakers streaming news. Testing during this orchestrated chaos reveals whether latency remains acceptable when multiple automations compete for hub attention.
Create a stress scenario that mimics realistic peak load:
- Trigger three motion sensors within 2 seconds
- Simultaneously adjust two thermostats via scheduled automation
- Stream music to a smart speaker
- Have someone actively using Wi-Fi for video streaming
Now test your baseline single-device automation. Latency typically increases 40-80% under load for Zigbee and Z-Wave networks due to mesh coordination overhead and hub processing queues. Wi-Fi devices show the most dramatic degradation—200-400% increases aren't uncommon when bandwidth saturates.
Thread networks demonstrate impressive resilience here. The protocol's IPv6 foundation and Border Router architecture maintain more consistent sub-150ms response times even under 10+ simultaneous device activations. This reliability makes Thread particularly suited for security-critical automations where predictable response matters more than absolute minimum latency.
Document any automation failures: commands that never execute, delayed by 3+ seconds, or execute out of sequence. These edge cases reveal protocol reliability limits that raw latency measurements miss.
Step 6: Test Wake-From-Sleep Latency for Battery Devices

Battery-powered sensors dominate the invisible integration aesthetic—no visible power cables, no proximity constraints to outlets. But their sleep/wake cycles introduce latency patterns that wired devices never experience.
Battery-powered Zigbee motion sensors typically sleep after 4-8 seconds of inactivity, entering a state where they wake only to check for network messages every 250ms-1000ms (configurable per device). The first motion detection after sleep must wake the sensor, establish radio connection, and then transmit—adding 50-300ms compared to subsequent detections within the wake window.
Test this explicitly:
- Trigger motion sensor and start baseline latency timer
- Wait exactly 10 seconds (ensure sensor returns to sleep)
- Trigger again and measure wake-plus-detection latency
- Immediately trigger a third time (sensor still awake) for comparison
Z-Wave Plus devices typically show 30-80ms wake penalties. Thread devices using Sleepy End Device (SED) modes maintain parent-child relationships with always-on routers, allowing wake times under 50ms. Wi-Fi battery devices face the harshest wake penalties—often 300-800ms as they reconnect to the access point, obtain IP addresses, and establish secure connections.
This wake latency rarely matters in bedrooms where 300ms between movement and light activation remains imperceptible in darkness. But in high-traffic hallways or security-critical applications like door sensors, that lag becomes meaningful. Consider wired sensors for these contexts, reserving battery devices for secondary zones where occasional microsecond delays go unnoticed.
Step 7: Document Fallback Behavior and Reliability Patterns
Speed means nothing if devices fail intermittently. Testing how to test smart device latency must include reliability assessment—documenting not just typical response times but the frequency and nature of failures.
Run your baseline automation 100 times over 3-4 days, varying times of day and network conditions. Record:
- Successful executions within expected latency window
- Delayed executions (3x normal latency or greater)
- Complete failures (no execution within 5 seconds)
- Partial executions (in multi-device automations, some devices respond, others don't)
Calculate a reliability percentage: (successful executions / total attempts) × 100. Anything below 95% suggests fundamental issues—weak mesh paths, hub processing bottlenecks, or device firmware problems. Zigbee and Z-Wave networks typically achieve 97-99% reliability when properly configured. Wi-Fi cloud-dependent devices often drop to 85-92% due to internet connectivity fluctuations.
Examine failure patterns for predictability. Do failures cluster during specific times (morning bandwidth congestion)? After specific sequences (always following another automation)? These patterns inform whether issues stem from environmental factors (fixable through network optimization) or inherent device limitations (resolvable only through replacement).
Test fallback behavior explicitly by disconnecting the hub from internet while leaving local network intact. Wi-Fi devices with local control continue operating; cloud-dependent devices fail completely. Zigbee, Z-Wave, and Thread networks continue unaffected—their mesh topologies operate independently of internet connectivity, a critical resilience feature often overlooked until outages occur.
Pro Tips & Common Mistakes
The most common testing error involves measuring total automation time rather than isolating individual protocol latency. When a motion-to-light automation takes 400ms, the instinct blames the protocol—but often 200ms comes from hub processing overhead, 100ms from poor mesh routing, and only 100ms from actual protocol communication. Test each component separately before concluding the protocol itself underperforms.
Never test during device firmware updates or mesh network reconfigurations. Zigbee networks rebuild routing tables after adding devices or power outages, introducing 30-60 minute periods of elevated latency and packet loss. Schedule testing 24+ hours after any network topology changes to ensure stabilization.
Compare protocols using identical spatial configurations. A Zigbee sensor positioned 15 feet from its nearest repeater through two walls naturally shows higher latency than a Wi-Fi device 8 feet from the router with clear line-of-sight. Fair comparison requires equivalent placement challenges or acknowledgment that spatial variables dominate protocol differences.
Battery level significantly affects latency for wireless devices. Test sensors at 100% charge and again at 20%—many Zigbee devices reduce transmission power as batteries drain, introducing 50-100ms additional latency to compensate for weaker signals. Replace batteries preemptively in critical automation zones rather than waiting for low-battery alerts.
Wi-Fi testing must distinguish between local and cloud processing. Devices executing commands locally through LAN protocols (like Shelly's local HTTP API) respond at 80-150ms—comparable to Zigbee. The same device using cloud polling introduces 300-1200ms latency depending on internet speed and service load. How to Compare Smart Home Device Protocols Before Buying clarifies these architectural differences.
When testing Matter devices, verify whether the controller implements native Matter support or bridges through proprietary protocols. An Apple HomePod controlling a "Matter" bulb through its native Thread radio achieves sub-100ms latency; controlling the same bulb through a Zigbee-to-Matter bridge introduces 80-150ms overhead as signals convert between protocols.
Frequently Asked Questions
What is acceptable latency for motion-activated lighting in smart homes?
Acceptable latency for motion-activated lighting ranges from 100-300ms depending on context and user sensitivity. High-traffic areas like hallways benefit from sub-150ms response times where occupants move quickly and expect instantaneous illumination. Secondary spaces like closets or storage rooms remain comfortable at 200-300ms since occupants enter more deliberately and tolerate brief darkness. Latency exceeding 400ms becomes perceptible to most users, creating a noticeable "lag" between movement and light that feels mechanical rather than responsive.
How does mesh network topology affect smart device latency?
Mesh network topology directly impacts latency through hop count and routing efficiency. Each mesh hop adds 15-30ms for Zigbee, 20-40ms for Z-Wave, and 10-20ms for Thread as signals traverse from endpoint device through intermediate routers to the hub. However, more mesh nodes can reduce total latency by providing shorter physical paths—a sensor connecting through two nearby routers at 40ms total outperforms a direct connection attempting to penetrate three walls at 150ms due to retry overhead from signal degradation.
Can I test smart device latency without specialized equipment?

Yes, smartphone timers or video recording provide sufficient precision for practical smart home latency testing. Video recording at 60fps delivers 16.7ms-per-frame resolution, adequate for distinguishing between protocols that typically differ by 50-200ms. For casual testing, a simple stopwatch captures differences between 100ms (imperceptible, feels instant) and 300ms+ (noticeable lag). Specialized network analyzers reveal packet-level timing but rarely change device selection decisions since protocol choice depends more on ecosystem compatibility, reliability patterns, and fallback behavior than pure millisecond optimization.
Why do some smart devices respond instantly sometimes and slowly other times?
Inconsistent smart device response times typically stem from battery-powered sensors transitioning between wake and sleep states, network congestion fluctuations, or hub processing queue variability. Battery devices add 50-300ms wake latency to the first trigger after idle periods but respond quickly during subsequent activity within their wake window. Wi-Fi devices experience dramatic latency spikes when routers handle 15+ simultaneous connections or internet bandwidth saturates. Hub CPU load above 60% introduces unpredictable queueing delays as automation rules compete for processing resources—Device Mesh Network Reliability Explained: Zigbee vs Z-Wave vs Thread explores these factors comprehensively.
Summary
Testing smart device latency transforms abstract protocol specifications into tangible insights about how technology will feel integrated into living spaces. Zigbee delivers consistent 100-150ms responses ideal for primary lighting automations, while Thread's emerging low-power efficiency achieves comparable speeds with better battery life. Z-Wave trades slightly higher latency (150-200ms) for superior reliability in challenging RF environments. Wi-Fi splits dramatically between local-control devices rivaling mesh protocols and cloud-dependent options introducing unpredictable delays.
The measurements matter less than what they reveal: whether automations will dissolve invisibly into daily rhythms or announce themselves through perceptible lag. Test methodically across realistic conditions, document failure patterns alongside speed metrics, and prioritize reliability over marginal millisecond advantages. The fastest protocol means nothing if it fails every twentieth trigger—better a consistent 200ms response than an average 100ms punctuated by random 3-second delays.
Those milliseconds accumulate into the difference between technology that serves quietly and gadgetry that demands attention through its own imperfection.