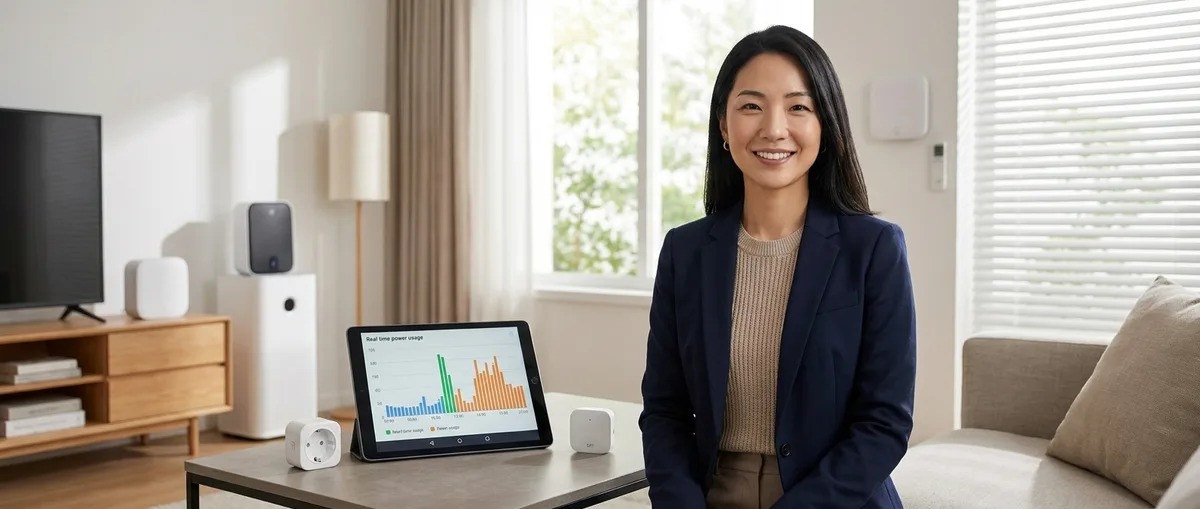
A smart home power monitoring system reveals the invisible—those quiet currents that hum through walls, the phantom loads that persist in darkness, the energy signatures that define how a household breathes. In 2026, with Matter 1.4 and mature Zigbee ecosystems, real-time tracking has evolved from clunky wall displays into something far more elegant: data that flows into the background of daily life, surfacing only when it matters, guiding decisions without demanding attention.
The difference between monitoring and living with energy awareness is design. When done well, the technology vanishes entirely.
What Is a Smart Home Power Monitoring System?
A smart home power monitoring system tracks electrical consumption in real time, measuring power draw at the circuit level, device level, or whole-home level. It translates raw watts and kilowatt-hours into actionable intelligence—revealing which appliances consume the most, identifying phantom loads, and enabling automations that respond dynamically to energy conditions.
These systems operate through in-line sensors (clamp monitors at the breaker panel), smart plugs with embedded metering (Zigbee or Matter protocol), or whole-home monitors that aggregate data from multiple sources. The critical distinction: protocol determines latency, reliability, and where the data lives.
Zigbee-based energy monitors communicate via low-power mesh networks, requiring a compatible hub (such as Home Assistant, Hubitat, or SmartThings) to process readings. Typical reporting latency: 1–3 seconds for plug-level sensors, suitable for real-time automations like load shedding or dynamic appliance scheduling. Zigbee's mesh architecture means each powered device strengthens the network—but also means a single point of failure (the hub) can silence the entire monitoring ecosystem during outages.
Matter 1.4 energy monitors operate across ecosystems—Apple Home, Google Home, Amazon Alexa, Home Assistant—without brand lock-in. Matter devices communicate over Thread (low-power mesh) or Wi-Fi, with energy reporting standardized through the Matter Energy Management cluster. Latency for Thread-based monitors: 2–5 seconds, slightly higher than Zigbee but with cross-platform redundancy. Wi-Fi Matter devices report faster (sub-second) but consume more power and lack mesh resilience.
The most invisible implementations combine panel-level CT clamp monitors (installed inside the breaker box, reading circuits individually) with device-level smart plugs for granular tracking of high-draw appliances. Data aggregates into a central hub or cloud platform, where machine learning algorithms identify consumption patterns—distinguishing the refrigerator's compressor cycle from the HVAC startup surge, or the phantom draw of a cable box left "off."
How It Works
The architecture of a smart home power monitoring system layers sensors, communication protocols, processing logic, and user-facing automation. Understanding each layer reveals where invisibility lives—and where compromises emerge.
Sensing Layer: Where Electrons Become Data

CT clamp current transformers wrap around individual circuit wires inside the breaker panel, measuring magnetic fields to infer current flow. Installed units like the Emporia Vue Gen 3 Energy Monitor use 16 CT clamps to track 16 circuits simultaneously, reporting via Wi-Fi to a cloud platform. Resolution: 1 watt increments. Update frequency: 1 second per circuit. The clamps themselves are invisible once the panel door closes—no visible hardware in living spaces.
Smart plugs with integrated metering sit between wall outlet and appliance, measuring voltage, current, power factor, and cumulative energy. Zigbee plugs (like third-generation Aqara Smart Plug) report to a Zigbee hub; Matter plugs (like Eve Energy Matter-enabled) report to any Matter controller. These devices are visible unless concealed—behind furniture, inside cabinets, or within custom millwork. (Hidden smart plugs require forward planning during construction or renovation; retrofits often compromise aesthetics.)
Whole-home monitors like the Sense Energy Monitor install at the main breaker, using machine learning to disaggregate individual appliance signatures from aggregate current flow. Latency: real-time for total load, minutes to hours for device-level identification (the algorithm learns patterns over weeks). This approach requires zero visible hardware beyond the panel, making it ideal for design-conscious installations—but it sacrifices the granular, instant device control offered by plug-level monitoring.
Communication Layer: Protocol Trade-Offs
Zigbee operates at 2.4 GHz with 128-bit AES encryption, forming a self-healing mesh where each powered device acts as a repeater. Maximum hop count: 30 devices between sensor and hub. For energy monitoring, this means a plug in the garage can route through the living room lamp, the bedroom outlet, and the hallway switch before reaching the hub. Fallback behavior: if the hub loses power and no UPS backup exists, all Zigbee reporting stops immediately. (See smart home backup power solutions for protocol-aware UPS sizing.) Network recovery time after power restoration: 15–90 seconds as devices re-establish mesh routing.
Matter over Thread uses IPv6-based mesh networking with border routers (HomePod mini, Google Nest Hub, or dedicated Thread routers) bridging to IP networks. Energy sensors report via Thread to the border router, which translates to Matter-standard attributes accessible by any Matter controller. Interoperability limitation: as of Matter 1.4, energy reporting standards exist but adoption is uneven—some manufacturers expose only binary on/off states, not cumulative kWh or instantaneous watts. Always verify the Matter Energy Management cluster is implemented before purchase. Thread's advantage: multiple border routers provide redundancy—if one fails, devices re-route through another within 10–30 seconds.
Wi-Fi monitors bypass hubs entirely, connecting directly to the home network and cloud services. Latency is lowest (sub-second reporting), but reliability depends on router uptime and internet connectivity. Fallback during outages: most Wi-Fi monitors cache data locally for 24–72 hours, syncing when connectivity restores. The invisible cost: Wi-Fi devices consume 10–20× more power than Zigbee or Thread equivalents, generating heat and requiring bulkier enclosures that resist concealment.
Processing Layer: Turning Data Into Intelligence
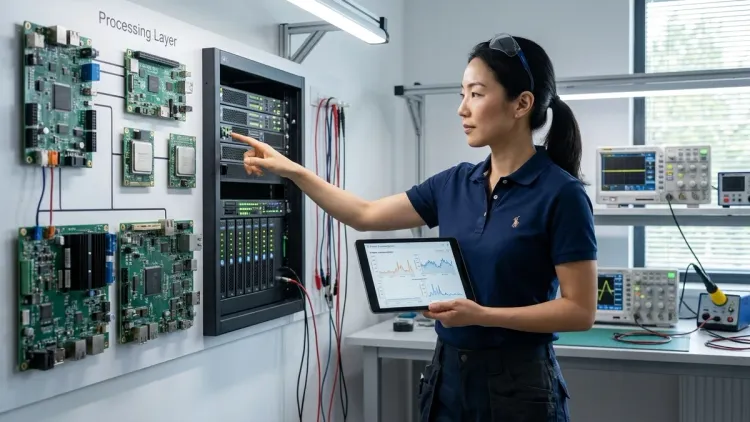
Raw sensor data flows into a hub (Home Assistant, Hubitat, SmartThings) or cloud platform (Sense, Emporia, manufacturer apps) where automation logic interprets readings. The sophistication here determines whether monitoring remains passive observation or becomes active energy management.
If/then automation logic for energy monitoring typically follows these patterns:
IF (device_power > threshold_watts) AND (time_of_day IN peak_hours)
THEN send_notification("High draw during peak pricing")

IF (total_home_load > 8000W) AND (EV_charger_state == "charging")
THEN reduce_EV_charge_rate(50%) OR pause_charging(30_minutes)

IF (phantom_load_detected > 5W) AND (device_state == "off") AND (time > 2AM)
THEN switch_outlet_off()

IF (solar_generation > home_consumption) AND (battery_charge < 90%)
THEN prioritize_battery_charging()
ELSE IF (solar_generation > home_consumption) AND (battery_charge >= 90%)
THEN enable_high_draw_appliances(dishwasher, laundry)
Latency expectations for automation execution:
- Zigbee sensor → hub → action: 2–5 seconds total
- Matter/Thread sensor → border router → controller → action: 3–7 seconds
- Wi-Fi sensor → cloud → hub → action: 1–10 seconds (variable, depends on internet latency)
- CT clamp panel monitor → cloud analysis → hub trigger: 5–15 seconds
These delays matter when implementing dynamic load balancing (detailed setup guide) or peak-hour load shedding. For safety-critical automations—like preventing circuit overload—local processing (hub-based, not cloud-dependent) is non-negotiable.
Reliability Factors and Failure Modes
Mesh network degradation: Zigbee and Thread networks rely on powered repeaters. If multiple smart plugs or switches lose power simultaneously (breaker trip, whole-home outage), the mesh fragments. Sensors farther from the hub may become unreachable even if they retain power. Recovery behavior: when power restores, devices rejoin the mesh in stages—expect 1–3 minutes before full network stability returns. (Mesh network reliability explores topology design to minimize single points of failure.)
Hub dependency: Zigbee and Thread systems cease functioning if the hub loses power without backup. For energy monitoring, this creates a paradox: the moment you most need load data (during an outage to manage battery runtime) is when Zigbee/Thread sensors go silent. Mitigation: UPS backup for hub and border routers (sizing guide), or hybrid systems combining Wi-Fi monitors (which cache locally) with mesh sensors for day-to-day granularity.
Cloud service outages: Wi-Fi-only monitors (Sense, Emporia Vue without hub) lose real-time viewing and automation triggers if the manufacturer's cloud goes offline. Historical data remains cached locally, but automations depending on cloud-to-hub integrations (IFTTT, Home Assistant cloud) break. Expected frequency: 2–4 outages per year, typically resolved within hours. For critical automations, local storage and hub-based logic eliminate this dependency.
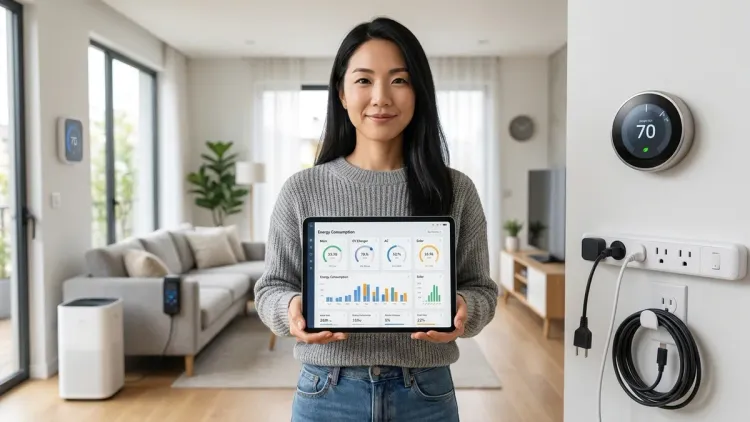
Why It Matters
Energy monitoring transforms abstract utility bills into visible patterns embedded in daily rhythm. The espresso machine that draws 1,400 watts for three minutes each morning. The HVAC system that cycles every 18 minutes on summer afternoons, pulling 3,200 watts per cycle. The phantom load—cable box, router, always-on devices—that collectively consumes 120 watts, 24 hours a day, adding $120 annually to the electric bill.
Behavioral visibility shifts how spaces are used. I worked with a family whose teenagers habitually left gaming consoles in "rest mode," drawing 80 watts continuously. A single automation—Zigbee plug that cut power after 30 minutes of idle draw below 90 watts—eliminated $85 in annual waste without requiring nagging or habit change. The technology disappeared; the savings persisted.
Dynamic pricing optimization matters more each year as utilities adopt time-of-use (TOU) rates with peak pricing 3–5× higher than off-peak. (Peak and off-peak automation logic explains rate-aware scheduling.) A smart home power monitoring system enables automations that shift flexible loads—dishwasher, laundry, EV charging, pool pumps—to low-cost hours. For a household with a 10 kWh/day flexible load and $0.40/kWh peak vs $0.08/kWh off-peak pricing, this represents $1,200 annual savings—enough to fund the monitoring system within 8–12 months.
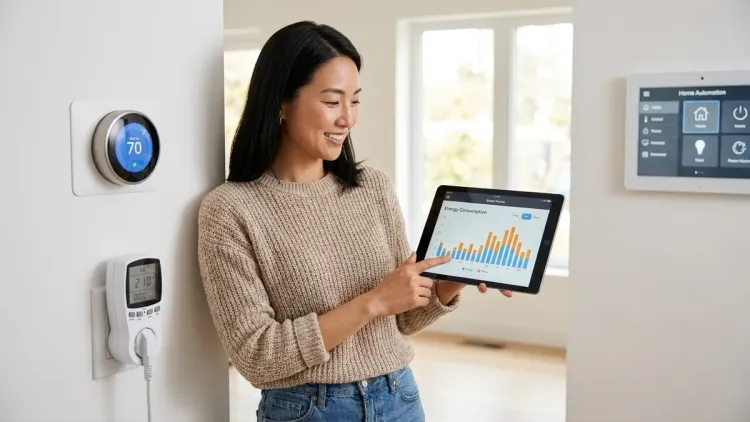
Integration with renewable generation and battery backup systems transforms monitoring from passive observation to active energy orchestration. When solar production exceeds consumption, automations prioritize battery charging, then enable discretionary loads. When batteries deplete during outages, monitoring data determines which circuits to shed first—preserving refrigeration and communications while cutting HVAC and entertainment systems. This logic requires sub-5-second latency and local hub processing to function during grid failures.
The most profound impact: energy awareness without energy anxiety. Poor implementations surface data constantly—dashboards, notifications, alerts—imposing cognitive load. Elegant systems operate silently, intervening only when action is warranted: a notification that phantom loads have crept upward, a gentle shift of appliance schedules during extreme pricing events, a monthly summary revealing seasonal consumption trends. The interface is absence; the result is efficiency.
Types & Variations
Whole-home panel monitors (comparison: Sense vs Emporia Vue) install at the main breaker, using CT clamps to measure all circuits or machine learning to disaggregate appliances. Protocol: typically Wi-Fi with cloud processing. Latency: real-time for total load, minutes to hours for device identification. Visibility: completely hidden inside the panel. Limitation: device-level accuracy varies (60–85% for common appliances); cannot control individual devices without additional smart plugs. Best for households prioritizing complete aesthetic invisibility over granular automation control.
Circuit-level monitoring with smart breakers replaces standard breakers with Zigbee or Matter-enabled versions (Eaton, Leviton) that report per-circuit power draw and enable remote disconnect. Protocol: Zigbee 3.0 or Matter over Thread (manufacturer-dependent). Latency: 2–5 seconds. Visibility: hidden inside panel. Cost: significantly higher ($60–120 per breaker vs $8–15 for standard). Reliability factor: breaker failure equals circuit outage; choose UL-listed devices with proven track records. Ideal for new construction or panel upgrades where per-circuit control justifies the investment.
Device-level smart plugs (energy monitoring comparison) provide the most granular control—measuring and switching individual appliances. Protocol options: Zigbee (Aqara, Third Reality), Matter (Eve Energy), or Wi-Fi (TP-Link Kasa). Latency: 1–3 seconds (Zigbee), 2–5 seconds (Matter/Thread), <1 second (Wi-Fi). Visibility: inherently obtrusive unless hidden behind furniture or inside cabinetry. Advantage: immediate device-level automations without panel modifications. Limitation: requires one plug per monitored appliance; costs scale with device count.
Hybrid systems combine panel-level monitoring for whole-home trends with selective plug-level sensors for high-priority devices (HVAC, EV charger, water heater). This approach balances cost, invisibility, and automation granularity. System setup checklist details device counts and hub requirements for typical installations.
Frequently Asked Questions
What smart home protocols work best for energy monitoring in 2026?
Zigbee and Matter over Thread offer the best balance of latency, reliability, and ecosystem flexibility for energy monitoring. Zigbee provides 1–3 second reporting with mature device selection and proven mesh stability, requiring a compatible hub like Home Assistant or Hubitat. Matter over Thread delivers cross-platform compatibility—working with Apple Home, Google Home, and Amazon Alexa simultaneously—with 2–5 second latency and built-in mesh redundancy through multiple border routers. Wi-Fi monitors report faster (sub-second) but consume significantly more power, generate heat, and depend on internet connectivity for cloud-based automations. For invisible installations prioritizing reliability during outages, Zigbee with UPS-backed hub infrastructure remains the most dependable choice, while Matter offers future-proofing for households wanting to avoid ecosystem lock-in.
How accurate are smart home energy monitors compared to utility meters?

Panel-level CT clamp monitors achieve 95–98% accuracy for whole-home consumption when properly calibrated, comparable to utility revenue meters. Device-level smart plugs typically measure within ±2% for resistive loads (heaters, lights) but accuracy degrades to ±5–10% for reactive loads (motors, power supplies) due to power factor variations. Machine learning-based disaggregation systems (Sense, Neurio) correctly identify individual appliances 60–85% of the time depending on appliance uniqueness—distinguishing an oven from a space heater is straightforward, but separating similar wattage devices like hair dryers and vacuum cleaners proves difficult. For actionable energy management, relative accuracy matters more than absolute precision—tracking whether a device's consumption increased 15% month-over-month reveals behavioral changes or equipment degradation even if the absolute wattage reading carries a ±3% margin. When financial decisions depend on precise measurements (solar net metering, demand charge optimization), supplement smart home monitors with utility-grade metering or third-party verification.
Do energy monitoring systems work during power outages?
Zigbee and Thread energy monitors require powered hubs and stop reporting immediately when hub power fails unless backed by a UPS or battery system. CT clamp panel monitors typically include internal batteries that log data locally for 24–72 hours during outages, syncing to the cloud when power restores—but real-time viewing and automations cease. Wi-Fi monitors lose connectivity during internet outages but may continue local logging if the router remains powered. For monitoring during extended outages (critical for battery runtime management), implement UPS backup for the hub, router, and border routers—adding 100–300 watts to your backup power requirements depending on system complexity. Alternatively, hybrid systems combining Wi-Fi monitors (which cache locally) with Zigbee or Matter sensors provide redundancy: cloud monitors track whole-home trends even when mesh networks fragment, while mesh sensors enable device-level automations when infrastructure remains powered. (Power outage preparation checklist details protocol-specific backup strategies.)
Can I automate appliances based on real-time energy prices?
Yes, with proper integration between your utility's pricing API and smart home hub. Most modern hubs (Home Assistant, Hubitat) support dynamic pricing integrations through custom components or community plugins that pull time-of-use rates, real-time wholesale pricing, or demand response events from utilities. Automations then trigger based on price thresholds—pausing EV charging when rates exceed $0.30/kWh, shifting dishwasher runs to overnight off-peak hours, or pre-cooling the home before peak pricing begins at 4 PM. Latency matters: price updates typically arrive 5–15 minutes before rate changes, requiring hub-based automation logic rather than cloud-dependent triggers to ensure timely response. (Energy-saving automations guide provides if/then templates for TOU optimization.) Limitation: not all utilities expose APIs—some require manual schedule entry or third-party middleware services. Verify your utility's data access policies before designing rate-responsive automations, and always include manual override controls for time-sensitive appliances (EV charging before morning commute, laundry for time-sensitive items) to prevent automation logic from creating inconvenience.
What's the difference between energy monitoring and energy management systems?
Energy monitoring measures and reports consumption passively; energy management acts on that data to optimize usage actively. A monitoring system tells you the dryer consumed 3.2 kWh yesterday; a management system schedules the dryer to run during off-peak hours, reduces its power draw during peak pricing, or pauses it when solar production dips below threshold. The distinction is automation logic and control capability. Management systems integrate monitoring sensors with smart switches, thermostats, HVAC controls, and battery systems—implementing dynamic load balancing, demand response, and renewable energy prioritization. For example, a management system might implement: IF (grid_price > $0.35/kWh) AND (battery_charge > 60%) THEN switch_to_battery_power() AND disable_non_critical_loads(). (Energy management complete guide details system architecture and device requirements.) Most households begin with monitoring to identify high-consumption patterns, then add management capabilities incrementally—starting with simple automations like phantom load elimination before advancing to sophisticated TOU optimization and renewable integration.
Summary
A smart home power monitoring system in 2026 offers unprecedented visibility into household energy flows through Zigbee, Thread, and Matter protocols—each trading latency, reliability, and aesthetic invisibility differently. Panel-level monitors disappear completely but sacrifice device-level control; smart plugs enable granular automation but challenge visual integration unless carefully concealed. The most elegant implementations layer whole-home tracking with selective device monitoring, feeding hub-based automation logic that shifts loads dynamically, eliminates phantom draw silently, and optimizes renewable generation without demanding conscious attention.
Energy awareness works best when it vanishes into the background—present as subtle behavioral guidance, surfacing only when action matters, transforming consumption from abstract numbers into patterns woven seamlessly into how a home feels throughout the day. The protocol choices, latency trade-offs, and fallback behaviors matter profoundly, but they matter because they determine whether technology serves invisibly or intrudes visibly. Choose systems that respect the spaces they inhabit, that operate reliably when needed most, and that reveal rather than obscure the rhythms of daily life.