Power failures interrupt the seamless rhythms of automation—lighting scenes freeze mid-transition, climate control halts, security sensors fall silent. Understanding how to calculate UPS runtime for smart home infrastructure ensures continuity when grid power fails, preserving not just connectivity but the invisible choreography of daily life. This guide walks through the precise methodology for determining battery backup duration across Zigbee coordinators, Wi-Fi access points, Z-Wave controllers, and Thread border routers, translating wattage consumption into real-world protection intervals.
Time required: 45-60 minutes
Skill level: Intermediate (requires basic electrical measurement and arithmetic)
What you'll achieve: Accurate runtime predictions for every automation hub in your infrastructure, plus a framework for scaling backup capacity to your actual power failure patterns.

What You'll Need
Measurement Tools:
- AC power meter or Kill A Watt P3 P4400 Electricity Usage Monitor (measures real-time wattage draw)
- Manufacturer spec sheets for each hub/router (typically available as PDFs on support sites)
- Calculator or spreadsheet application
System Documentation:
- Current UPS model specifications (battery capacity in volt-ampere-hours or watt-hours)
- List of all devices connected to each UPS unit
- Network topology diagram showing which hubs depend on which infrastructure
Optional Reference:
- Historical power outage data for your area (from utility provider)
- Smart home power monitoring data if already deployed (see smart home power monitoring systems for implementation guidance)
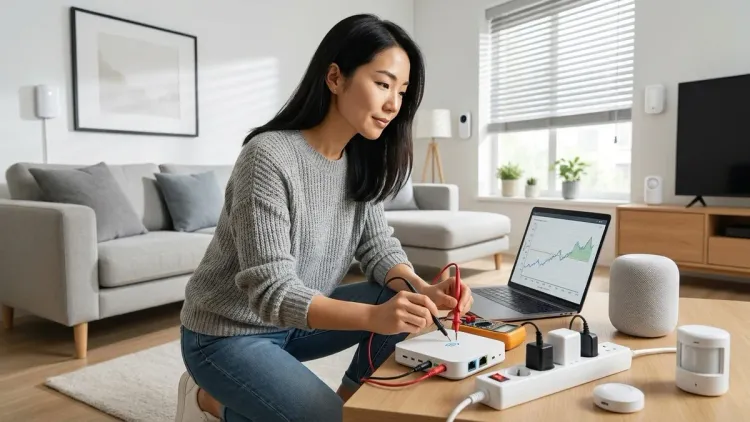
Step 1: Measure Actual Power Consumption for Each Hub
Manufacturer specifications rarely reflect real-world draw—a Zigbee coordinator listed at 5W may idle at 2.3W, then spike to 7W during network formation events. Connect each hub individually to a power meter for 24 hours to capture its consumption pattern across different operational states.
Protocol-specific consumption patterns:
Zigbee coordinators (SmartThings, Hubitat, Home Assistant with Zigbee radio): Typically draw 2-6W at idle. During device pairing or mesh healing, consumption may double momentarily. The SmartThings Aeotec Smart Home Hub averages 4.2W in steady state with 40+ connected devices.
Z-Wave controllers (Aeotec, HomeSeer): Range from 3-8W depending on 500-series versus 700-series chipsets. Z-Wave Plus devices support beamforming, which increases momentary power draw during status updates. Long Range Z-Wave controllers consume 15-20% more than standard implementations.
Wi-Fi access points: The infrastructure backbone that every protocol ultimately depends on. A dual-band mesh node draws 8-15W; tri-band models with Wi-Fi 6E consume 12-22W. These remain your highest continuous load.
Thread border routers (HomePod mini, Google Nest Hub): Low power by design, typically 2-4W. Apple's HomePod mini draws approximately 2.8W when actively routing Thread network traffic.
Matter controllers: Since Matter operates over Thread, Wi-Fi, or Ethernet backhauls, consumption depends entirely on the underlying protocol—a Matter-over-Thread setup mirrors Thread consumption; Matter-over-Wi-Fi mirrors Wi-Fi patterns.
Record the maximum observed wattage, not the average—runtime calculations must accommodate peak demand to prevent premature shutdown during mesh network healing or firmware updates.
Step 2: Calculate Total Connected Load in Watts

Sum the maximum wattage of every device connected to each UPS. This includes not just smart home hubs but supporting infrastructure: cable modems, ethernet switches, NAS devices storing local security footage, and any subscription-free security cameras with local recording.
Critical dependency mapping:
If your Zigbee hub connects via Ethernet to a PoE switch, that switch must remain powered or the hub loses connectivity regardless of its own backup power. Many invisible automation failures trace back to overlooked infrastructure dependencies—I've consulted in homes where residents invested in hub-specific UPS units while leaving the primary router unprotected.
Realistic example calculation:
- Wi-Fi 6 mesh router (primary): 14W
- Wi-Fi satellite node: 11W
- Zigbee coordinator (Hubitat C-8): 5W
- Z-Wave controller (Aeotec Gen7): 6W
- Ethernet switch (8-port managed): 9W
- Cable modem: 12W
- Total connected load: 57W
Add a 10% safety margin for measurement variance and aging component drift: 57W × 1.10 = 62.7W effective load.
For homes with concealed smart home hubs hidden in millwork or cabinetry, verify adequate ventilation around UPS units—battery efficiency degrades rapidly above 77°F ambient temperature.
Step 3: Identify UPS Battery Capacity in Watt-Hours
UPS specifications list capacity in one of three formats: volt-ampere-hours (VAh), amp-hours (Ah), or watt-hours (Wh). To calculate UPS runtime for smart home infrastructure, all values must be converted to watt-hours.
Conversion formulas:
From volt-ampere-hours to watt-hours:Wh = VAh × Power Factor
Smart home hubs present near-unity power factor loads (minimal reactive power), so use 0.90 as the power factor for conservative estimation. A 450VAh UPS becomes: 450 × 0.90 = 405Wh usable capacity.
From amp-hours to watt-hours:Wh = Ah × Battery Voltage
Most consumer UPS units use 12V lead-acid batteries. A 9Ah battery yields: 9 × 12 = 108Wh capacity.
Battery chemistry efficiency losses:
Lead-acid batteries (most affordable UPS models): Assume 80% usable capacity due to voltage sag under load and deliberate depth-of-discharge limiting to extend battery lifespan. A 405Wh rated battery delivers approximately 324Wh before the UPS triggers low-battery shutdown.
Lithium iron phosphate batteries (premium models like CyberPower OR500LCDRM1U): Deliver 95% usable capacity with flat discharge curves, allowing deeper safe discharge. These cost 2-3× more but provide 30-40% longer runtime per watt-hour.
Invisible alternative: For homes prioritizing aesthetic integration, consider whole home battery systems with dedicated smart home circuits—these eliminate visible UPS units entirely while providing hours-to-days of runtime depending on solar integration and battery capacity.
Step 4: Calculate Theoretical Runtime Using the Core Formula
The fundamental runtime equation:
Runtime (hours) = (Battery Capacity in Wh × Usable %) ÷ Total Load in Watts
Using the example from Steps 2-3:
- Battery capacity: 405Wh (450VAh UPS)
- Usable capacity: 405 × 0.80 = 324Wh (lead-acid chemistry)
- Total load: 62.7W
- Runtime: 324 ÷ 62.7 = 5.17 hours (5 hours, 10 minutes)
This represents steady-state runtime under continuous load. Real-world performance varies based on several protocol-specific factors.
Step 5: Account for Protocol-Specific Power Surge Events
Smart home protocols exhibit non-linear power consumption during specific operations that standard UPS runtime calculators ignore. These events reduce effective battery runtime by 8-25% depending on mesh density and automation complexity.
Zigbee mesh healing: When AC power fails and then briefly flickers (brown-out conditions), Zigbee coordinators initiate network-wide route recalculation. For networks with 30+ devices, this can spike coordinator power draw to 180-250% of idle consumption for 45-90 seconds. If your automations include smart lighting scenes triggered by power restoration, these compound the surge.
Z-Wave network-wide inclusion mode: Less common during outages, but if your automation logic includes IF power_restored THEN heal_network sequences (recommended practice), expect 2-3 minute surges at 150% normal draw.
Wi-Fi client reconnection storms: The most significant drain. When a mesh router on UPS power cycles, every Wi-Fi device (including Matter-over-Wi-Fi endpoints, cloud-dependent smart switches, and IP cameras) attempts simultaneous reconnection. A router serving 40+ clients may draw 200-300% of rated power for 3-5 minutes during this stampede.
Thread network reformation: Lower impact due to the protocol's sleeping-router architecture, but border routers still experience 30-60 second surges at 140% baseline when rebuilding partition tables.
Mitigation strategy: Reduce calculated runtime by 15% for mesh-heavy environments to accommodate these surge events. The previous 5.17-hour calculation becomes: 5.17 × 0.85 = 4.4 hours realistic runtime (4 hours, 24 minutes).
For detailed automation logic to manage these transitions gracefully, see how to configure smart home fallback automations during power outages.
Step 6: Validate Your Calculations With Real-World Testing
No calculation substitutes for empirical verification. Schedule a controlled power failure test during low-stakes hours:
Test protocol:
- Disable all non-essential automations temporarily (irrigation controllers, robotic lawn equipment—see how to connect robotic yard equipment for proper isolation procedures)
- Trip the breaker feeding your UPS units while monitoring start time
- Observe hub status LEDs and network connectivity via a battery-powered device
- Record the timestamp when the UPS begins alarm/warning tones (typically 20% battery remaining)
- Record total runtime until UPS shutdown
- Restore power and document any mesh network recovery behaviors
Expected variance: Real-world runtime should fall within ±12% of calculated predictions for UPS units less than 2 years old. Larger discrepancies indicate battery degradation or measurement errors in Step 1.
Protocol recovery observations:
Zigbee networks with proper mesh topology recover within 30-90 seconds of power restoration. Z-Wave networks take 45-120 seconds due to sequential node polling. Matter-over-Thread mirrors Thread timing (45-75 seconds). Wi-Fi infrastructure typically restores fastest (15-45 seconds), but dependent smart devices lag during the authentication and IP assignment phase.
Thread and Matter devices exhibit superior graceful degradation: even if the border router loses power, Thread sleeping-end-devices maintain their mesh relationships and resume instantly when the border router returns. Zigbee and Z-Wave networks experience more significant disruption if the coordinator powers down.
Step 7: Design Tiered Backup Based on Protocol Priority

Not all hubs require equal runtime—strategic tiering extends protection for critical systems while managing UPS investment costs.
Tier 1 (Maximum runtime target: 4-8 hours):
- Wi-Fi infrastructure (modem + primary router)
- Security system hub and monitoring cameras
- Zigbee/Z-Wave coordinator if it controls door locks, smoke detectors, or leak sensors
Tier 2 (Moderate runtime target: 2-4 hours):
- Mesh satellite nodes supporting important zones (bedrooms, primary living areas)
- Climate control interfaces
- Thread border routers managing safety-critical endpoints
Tier 3 (Minimal runtime target: 30-90 minutes):
- Ambient lighting controllers
- Entertainment system smart devices
- Irrigation and outdoor automation hubs
Implementation approach: Use separate UPS units for each tier, sized precisely to their load and target runtime. A Tier 1 hub cluster drawing 35W requiring 6-hour runtime needs: 35W × 6h = 210Wh minimum, or 262Wh accounting for 80% battery efficiency, equivalent to a 290VAh UPS.
For reference on device prioritization during extended outages, consult the smart home power outage preparation checklist.
Invisible alternative: In-wall or furniture-integrated UPS systems eliminate visible battery boxes. Several manufacturers now offer shallow-depth backup modules designed for millwork integration—these mount behind credenzas, inside built-in desks, or within media console back panels. Pair with hidden smart plugs for completely concealed backup power pathways.
Step 8: Monitor Battery Health and Recalculate Quarterly
Battery capacity degrades 15-25% annually in typical residential conditions. Schedule quarterly runtime verification to detect degradation before it impacts actual outages:
Automated monitoring approach:
- Deploy a smart home energy monitoring system with UPS-specific monitoring capability
- Configure alerts for runtime predictions falling below your minimum threshold
- Track battery replacement intervals (typically 3-5 years for lead-acid, 8-12 years for lithium chemistries)
If-then automation for battery health:
IF UPS_runtime_calculation < minimum_acceptable_hours THEN
  Send notification to primary_user AND home_dashboard
  Log battery_age AND last_replacement_date
  IF battery_age > manufacturer_service_life THEN
    Add "Replace UPS battery" to maintenance_queue
    Escalate notification priority to urgent
  END IF
END IF
This logic integrates cleanly with Home Assistant, Hubitat, or SmartThings platforms. For homes using Matter-native controllers, battery monitoring requires a compatible power meter since Matter 1.4 doesn't yet define native UPS device types—see Matter 1.4 device setup requirements for current protocol limitations.
Temperature impact: For every 15°F above 77°F ambient temperature, battery service life decreases by approximately 50%. If your hubs hide in enclosed cabinetry without ventilation, install passive convection vents or small thermostat-controlled exhaust fans to maintain sub-80°F conditions.
Pro Tips & Common Mistakes
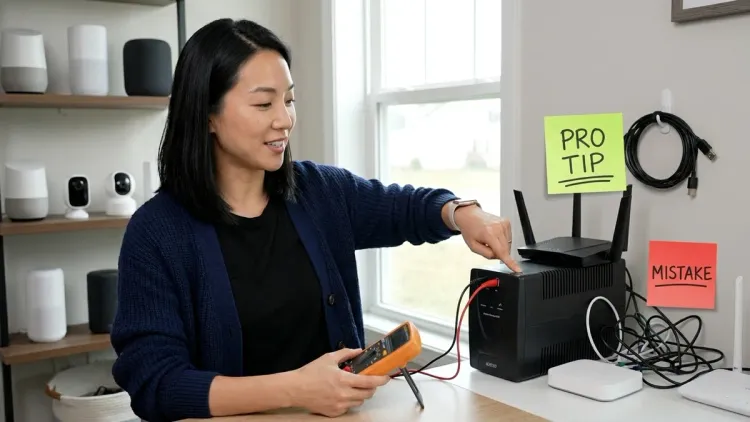
Most overlooked calculation error: Failing to include ethernet switches in total load calculations. A managed 8-port switch may draw 9-12W continuously—more than many Zigbee coordinators. I've worked with clients whose meticulously calculated runtimes fell short by 40% because they powered hubs but forgot the network backbone connecting them.
Power factor confusion: Don't use the UPS's output VA rating directly as watt capacity. A 900VA UPS with 0.6 power factor delivers only 540W maximum—attempting to draw more triggers immediate overload shutdown. Smart home loads present excellent power factor (0.9-0.95), but verify your specific UPS specifications rather than assuming.
Battery age blindness: A five-year-old UPS with never-replaced batteries retains perhaps 40-60% of original capacity. Calculate runtime using actual current capacity, not the nameplate rating from purchase date. The Battery University maintains authoritative degradation curves for all common chemistries.
Protocol-specific mistake—Zigbee: Coordinators with USB power inputs often accept wide voltage ranges (4.5-5.5V) but deliver peak performance only at 5.0V±2%. Generic UPS USB ports sometimes output 4.8V under load, causing subtle mesh instability. Use the coordinator's AC adapter plugged into standard UPS outlets instead.
Protocol-specific mistake—Z-Wave: 700-series controllers draw higher instantaneous current during transmission than 500-series chipsets, occasionally triggering nuisance UPS alarms if the unit interprets this as a short-circuit condition. Size UPS capacity at least 3× the Z-Wave controller's peak draw to avoid false alarms.
Hidden runtime killer: Smart home hubs often host add-on USB devices—Zigbee dongles, Z-Wave sticks, Thread radios. A Raspberry Pi running Home Assistant might measure 8W alone, but add three USB protocol radios and power draw climbs to 14W. Measure the complete assembled system, not just the base computer.
Climate consideration: Runtime calculations assume 72°F ambient temperature. Battery capacity drops 20-35% at 40°F (unheated utility rooms, detached workshops). If your Zigbee coordinator lives in the garage controlling autonomous yard equipment, account for temperature-adjusted capacity during winter months.
Frequently Asked Questions
How do I calculate UPS runtime for a smart home with multiple protocol hubs on one battery backup?
Measure each hub's power consumption individually using an AC power meter, sum all connected device wattages (including routers and switches), add a 10% safety margin, then divide the UPS battery capacity in watt-hours by this total load. For a 450VAh UPS with 80% usable capacity (324Wh) supporting 65W total load: 324 ÷ 65 = approximately 5 hours of runtime under steady state, or 4.25 hours accounting for protocol mesh healing surge events that occur when power fails or restores.
Does the smart home protocol choice (Zigbee vs Z-Wave vs Thread vs Wi-Fi) significantly affect backup power runtime?
Protocol choice affects runtime indirectly through two mechanisms: baseline power consumption and surge behavior during network events. Wi-Fi infrastructure consumes 3-5× more power than low-power mesh protocols like Zigbee or Thread, dramatically reducing runtime—a Wi-Fi mesh system might draw 25W while equivalent Zigbee coverage uses 6W. However, Wi-Fi routers typically recover faster after power restoration (15-45 seconds versus 45-120 seconds for Z-Wave), reducing the cumulative impact of surge events across multiple short outages.
Should I calculate separate UPS runtime for my Zigbee coordinator versus my Wi-Fi router, or back them up together?
Separate UPS units offer superior runtime optimization but introduce dependency risks—if the router loses power while the Zigbee hub remains powered, cloud-dependent automations fail and remote access breaks even though local mesh control continues. For most residential deployments, back up all network infrastructure together (router, switch, modem, and all protocol coordinators) using a single appropriately sized UPS, then add secondary smaller UPS units for remote mesh satellite nodes or detached building hubs that serve independent automation zones like workshops or pool equipment.
How often do I need to recalculate UPS runtime as my smart home devices age?
Recalculate quarterly during the first year after UPS installation to establish a degradation baseline, then shift to semi-annual verification once you understand your specific battery aging pattern. UPS batteries degrade 15-25% annually under typical conditions, so a system delivering 5-hour runtime when new provides approximately 3.75-4.25 hours after two years. Plan battery replacement when runtime falls below your minimum acceptable threshold—typically when measured capacity reaches 60-70% of original specification, which occurs after 3-5 years for lead-acid batteries or 8-12 years for lithium iron phosphate chemistries.
Summary
Learning to calculate UPS runtime for smart home infrastructure transforms backup power from vague reassurance into precise, verifiable protection. By measuring actual consumption across Zigbee coordinators, Z-Wave controllers, Thread border routers, and Wi-Fi mesh nodes—then accounting for protocol-specific surge behaviors and battery efficiency—you create runtime predictions accurate within ±12% of real-world performance.
The process requires initial measurement effort but yields permanent benefits: right-sized UPS investments, tiered backup strategies that protect critical systems longer, and quarterly verification rhythms that catch battery degradation before actual outages expose the gap. Automation shouldn't announce its presence through failures when power flickers—proper runtime calculation ensures the invisible intelligence woven through your spaces continues its work regardless of grid stability.
For comprehensive guidance on broader backup strategies beyond individual UPS units, explore smart home backup power solutions and battery backup versus generator comparisons covering whole-home approaches that eliminate runtime constraints entirely.